
一、前言
我们都知道Spring Boot是一个用于快速开发Java Web的框架,不需要太多的配置即可使用Spring的大量功能。Spring Boot遵循着“约定大于配置”的原则,许多功能使用默认的配置即可。这样的做法好处在于我们不需要像使用Spring那样编写一大堆的XML配置代码,但过于简单的配置过程会让我们在了解各种依赖,配置之间的关系过程上带来一些困难。不过没关系,在Spring Boot中,我们可以使用Actuator来监控应用,Actuator提供了一系列的RESTful API让我们可以更为细致的了解各种信息。
二、引入Actuator
1 | <dependency> |
三、配置Actuator
1 | management: |
配置中关闭了安全认证的功能,如果需要开启这个功能的话还需引入spring-boot-starter-security依赖。除了使用Spring Security来开启监控路径安全认证外,还可以使用Shiro对监控路径进行权限控制。
监控的端口和应用一致,配置context-path为/monitor,这样可以避免和自己应用的路径映射地址重复。
endpoints.shutdown.enabled: true提供了使用post请求来关闭Spring Boot应用的功能。
四、Actuator接口列表
以下是一些非常有用的actuator endpoints列表。你可以在 official documentation 上面看到完整的列表。
| HTTP方法 | 路径 | 描述 |
|---|---|---|
| GET | auditevents | 显示应用暴露的审计事件(比如认证进入、订单失败) |
| GET | info | 显示应用的基本信息 |
| GET | health | 显示应用的健康状态 |
| GET | metrics | 显示应用多样的度量信息 |
| GET | loggers | 显示和修改配置的loggers |
| GET | logfile | 返回logfile中的内容(如果logging.file或者logging.path被设置) |
| GET | httptrace | 显示HTTP足迹,最近100个HTTPrequest/repsponse |
| GET | env | 显示当前的环境特性 |
| GET | flyway | 显示数据库迁移路径的详细信息 |
| GET | liquidbase | 显示Liquibase数据库迁移的纤细信息 |
| POST | shutdown | 让你逐步关闭应用 |
| GET | mappings | 显示所有的@RequestMapping路径 |
| GET | scheduledtasks | 显示应用中的调度任务 |
| GET | threaddump | 执行一个线程dump |
| GET | heapdump | 返回一个GZip压缩的JVM堆dump |
五、打开和关闭Actuator Endpoints
默认,上述所有的endpints都是打开的,除了shutdown endpoint。
你可以通过设置management.endpoint.{id}.enabled to true or false(id是endpoint的id)来决定打开还是关闭一个actuator endpoint。
举个例子,要想打开shutdown endpoint,增加以下内容在你的application.properties文件中:
1 | management: |
六、暴露Actuator Endpoints
默认,素偶偶的actuator endpoint通过JMX被暴露,而通过HTTP暴露的只有health和info。
以下是你可以通过应用的properties可以通过HTTP和JMX暴露的actuator endpoint。
6.1 通过HTTP暴露Actuator endpoints
1 | management: |
6.2 通过JMX暴露Actuator endpoints
1 | management: |
通过设置management.endpoints.web.exposure.include为*,我们可以在 http://localhost:8080/actuator 页面看到如下内容。
1 | { |
七、/health endpoint
7.1 说明
health endpoint通过合并几个健康指数检查应用的健康情况。
Spring Boot Actuator有几个预定义的健康指标比如DataSourceHealthIndicator,DiskSpaceHealthIndicator, MongoHealthIndicator,RedisHealthIndicator, CassandraHealthIndicator等。它使用这些健康指标作为健康检查的一部分。
举个例子,如果你的应用使用Redis,RedisHealthindicator将被当作检查的一部分。如果使用MongoDB,那么MongoHealthIndicator将被当作检查的一部分。
你也可以关闭特定的健康检查指标,比如在yml中使用如下命令:
1 | management: |
7.2 显示详细的健康信息
health endpoint只展示了简单的UP和DOWN状态。为了获得健康检查中所有指标的详细信息,你可以通过在application.yaml中增加如下内容:
1 | management: |
一旦你打开上述开关,你在/health中可以看到如下详细内容: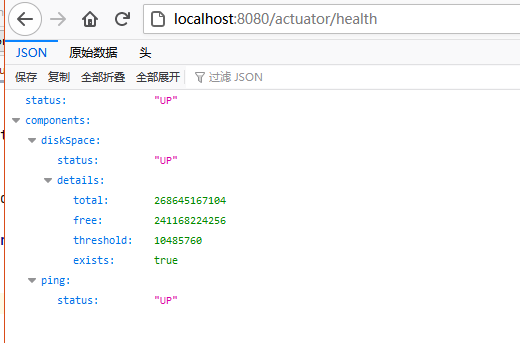
7.3 创建一个自定义的健康指标
你可以通过实现HealthIndicator接口来自定义一个健康指标,或者继承AbstractHealthIndicator类。
1 | @Component |
一旦你增加上面的健康指标到你的应用中去后,health endpoint将展示如下细节: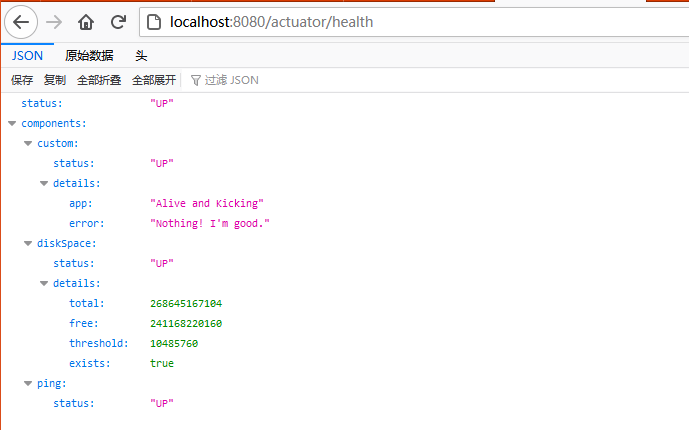
八、/metrics endpoint
metrics endpoint展示了你可以追踪的所有的度量。
想要获得每个度量的详细信息,你需要传递度量的名称到URL中,像http://localhost:8080/actuator/metrics/{MetricName}
举个例子,获得systems.cpu.usage的详细信息,使用以下URL http://localhost:8080/actuator/metrics/system.cpu.usage 。它将显示如下内容:
九、/loggers endpoint
loggers endpoint,可以通过访问 http://localhost:8080/actuator/loggers 来进入。它展示了应用中可配置的loggers的列表和相关的日志等级。
你同样能够使用http://localhost:8080/actuator/loggers/{name} 来展示特定logger的细节。
举个例子,为了获得root logger的细节,你可以使用 http://localhost:8080/actuator/loggers/root :
在运行时改变日志等级
loggers endpoint也允许你在运行时改变应用的日志等级。
举个例子,为了改变root logger的等级为DEBUG ,发送一个POST请求到 http://localhost:8080/actuator/loggers/root ,加入如下参数 {"configuredLevel": "DEBUG"}
十、/info endpoint
info endpoint展示了应用的基本信息。它通过META-INF/build-info.properties来获得编译信息,通过git.properties来获得Git信息。它同时可以展示任何其他信息,只要这个环境property中含有infokey。
你可以增加properties到application.yaml中,比如:
1 | info: |
一旦你增加上面的properties,info endpoint将展示如下信息:
十一、使用Spring Security来保证Actuator Endpoints安全
ctuator endpoints是敏感的,必须保障进入是被授权的。如果Spring Security是包含在你的应用中,那么endpoint是通过HTTP认证被保护起来的。
如果没有, 你可以增加以下以来到你的应用中去:
1 | <dependency> |
接下去让我们看一下如何覆写spring security配置,并且定义你自己的进入规则。
下面的例子展示了一个简单的spring securiy配置。它使用叫做EndPointRequest的ReqeustMatcher工厂模式来配置Actuator endpoints进入规则。
1 | @Configuration |
为了能够测试以上的配置,你可以在application.yaml中增加spring security用户
1 | spring: |